Base-calling the MinION raw fast5 files
MinKnow is the interface software to the Minion handheld device, for configurations, sequencing initiation and transfer of the sequencing signals from the device to the computer.
By default MinKnow generates FASTQ files (basecalled) from the fast5 files (raw signal files) in real time.
Otherwise, after the sequencing finished, one can separately use the MinKnow integrated basecaller or another basecaller (such as Albacore) to generate fastq files from the fast5 files.
- Install MinKnow by following the instructions from Nanopore
- This step is a prerequisite for sequencing and MinKnow must be installed before starting the sequencing process. We can still reuse it for base-calling the raw files after and independent of the sequencing.
- The installation can take up to ~20 minutes.
- A registered account is needed (ouch).
- You may skip the
EPI2ME Agentstep.
- Run MinKnow on the files generated before by the MinION.
- MinKnow can be used to base-call the signals also in real-time using the Guppy basecaller from MinKnow.
- Realtime base-calling is enabled by default.
- It might be better to skip the real time base-calling, especially if you are not sure about the sufficiency of hardware resources (such as SSD storage capacity, memory, CPU), or the expected amount of reads.
Installing standalone Guppy
Guppy is “the base-caller” (stand June-2019).
- Find and follow your target Guppy architecture installation instruction from the ONT software download page https://community.nanoporetech.com/downloads
- Protocols available at https://community.nanoporetech.com/protocols/Guppy-protocol
- Call example (please update and specify the correct flowcell and kit type): ` guppy_basecaller –input_path /data/my_folder/reads –save_path /data/output_folder/basecall –flowcell FLO-MIN106 –kit SQK-LSK109
`
- Call example (please update and specify the correct flowcell and kit type): ` guppy_basecaller –input_path /data/my_folder/reads –save_path /data/output_folder/basecall –flowcell FLO-MIN106 –kit SQK-LSK109
Installing Albacore for base calling (optional)
Albacore is/used-to-be one of the recommended base-callers, an example of call which is tuned for our first sequencing data is:
- Install Albacore basecaller (optional) by following the instructions from Nanopore
-
Run it using
$ read_fast5_basecaller.py --flowcell FLO-MIN106 --kit SQK-RAD004 --output_format fast5,fastq --input fast5/ --save_path fast5-albacore/ --worker_threads 4 -r
For details, please double check the documentation and guide in the Nanopore website.
Taxonomy identification
All-in-one Galaxy workflow (simple)
- Upload the DNA data (the basecalled
passedfastq) to the Street Science European Galaxy server https://streetscience.usegalaxy.eu/.- Using the interface from the top left tool bar.
- Import the Kraken2 based shared workflow from this link https://usegalaxy.eu/u/milad/w/metagenomics-krakan2.
- By clicking to the “+” import logo
- Find and run the imported workflow.
- From the
workflowtab on top of the page. - Click the dropdown arrow and select
Runor theRun play logofrom the workflow editor page.
- From the
- Select the uploaded fastq file as input for
reads.fastqentry.- In case you cannot see the fastq file from the dropdown selection list, convert the entry datatype to
fastqsanger. Select the pen logoEdit attributes->Data types->New Type->fastqsangerthen pushChange datatype.
- In case you cannot see the fastq file from the dropdown selection list, convert the entry datatype to
Step-by-step procedure using Galaxy tools (advanced)
Using Kraken2 on Galaxy
Kraken2 is an open source softwares that is recommended for metagenomic analysis of Nanopore data. The databases for several domains are integrated and available on the Street Science Galaxy
- Go to https://streetscience.usegalaxy.eu/
- Create an account (if you do not have one)
- Create a new history
- Upload the fastq file to usegalaxy.eu
- Search for Kraken2 from the tools section
- Run Kraken2 on the fastq file with these options
- “Single or paired reads”:
Single- “Input sequences”: imported file
- “Print scientific names instead of just taxids” :
Yes - In “Create Report”
- “Print a report with aggregrate counts/clade to file”:
Yes
- “Print a report with aggregrate counts/clade to file”:
- “Select a Kraken2 database”:
fungi
- “Single or paired reads”:
Kraken2 generated a tabular file as well as a report.
The report is a text file with a tree-like structure that can be downloaded and viewed in an editor. E.g.
39.40  1335    1335    U       0       unclassified
 60.60  2053    0       R       1       root
 60.60  2053    0       R1      131567    cellular organisms
 60.60  2053    0       D       2759        Eukaryota
 60.60  2053    0       D1      33154         Opisthokonta
 60.60  2053    0       K       4751            Fungi
 60.60  2053    2       K1      451864            Dikarya
 60.48  2049    0       P       4890                Ascomycota
 60.48  2049    1       P1      716545                saccharomyceta
 60.18  2039    0       P2      147537                  Saccharomycotina
 60.18  2039    0       C       4891                      Saccharomycetes
 60.18  2039    5       O       4892                        Saccharomycetales
 59.80  2026    19      F       4893                          Saccharomycetaceae
 56.55  1916    34      G       4930                            Saccharomyces
 53.34  1807    0       S       4932                              Saccharomyces cerevisiae
 53.34  1807    1807    S1      559292                              Saccharomyces cerevisiae S288C
  2.21  75      75      S       1080349                           Saccharomyces eubayanus
Where the column fields are:
1. Percentage of fragments covered by the clade rooted at this taxon
2. Number of fragments covered by the clade rooted at this taxon
3. Number of fragments assigned directly to this taxon
4. A rank code, indicating (U)nclassified, (R)oot, (D)omain, (K)ingdom,
   (P)hylum, (C)lass, (O)rder, (F)amily, (G)enus, or (S)pecies.
   Taxa that are not at any of these 10 ranks have a rank code that is
   formed by using the rank code of the closest ancestor rank with
   a number indicating the distance from that rank.  E.g., "G2" is a
   rank code indicating a taxon is between genus and species and the
   grandparent taxon is at the genus rank.
5. NCBI taxonomic ID number
6. Indented scientific name
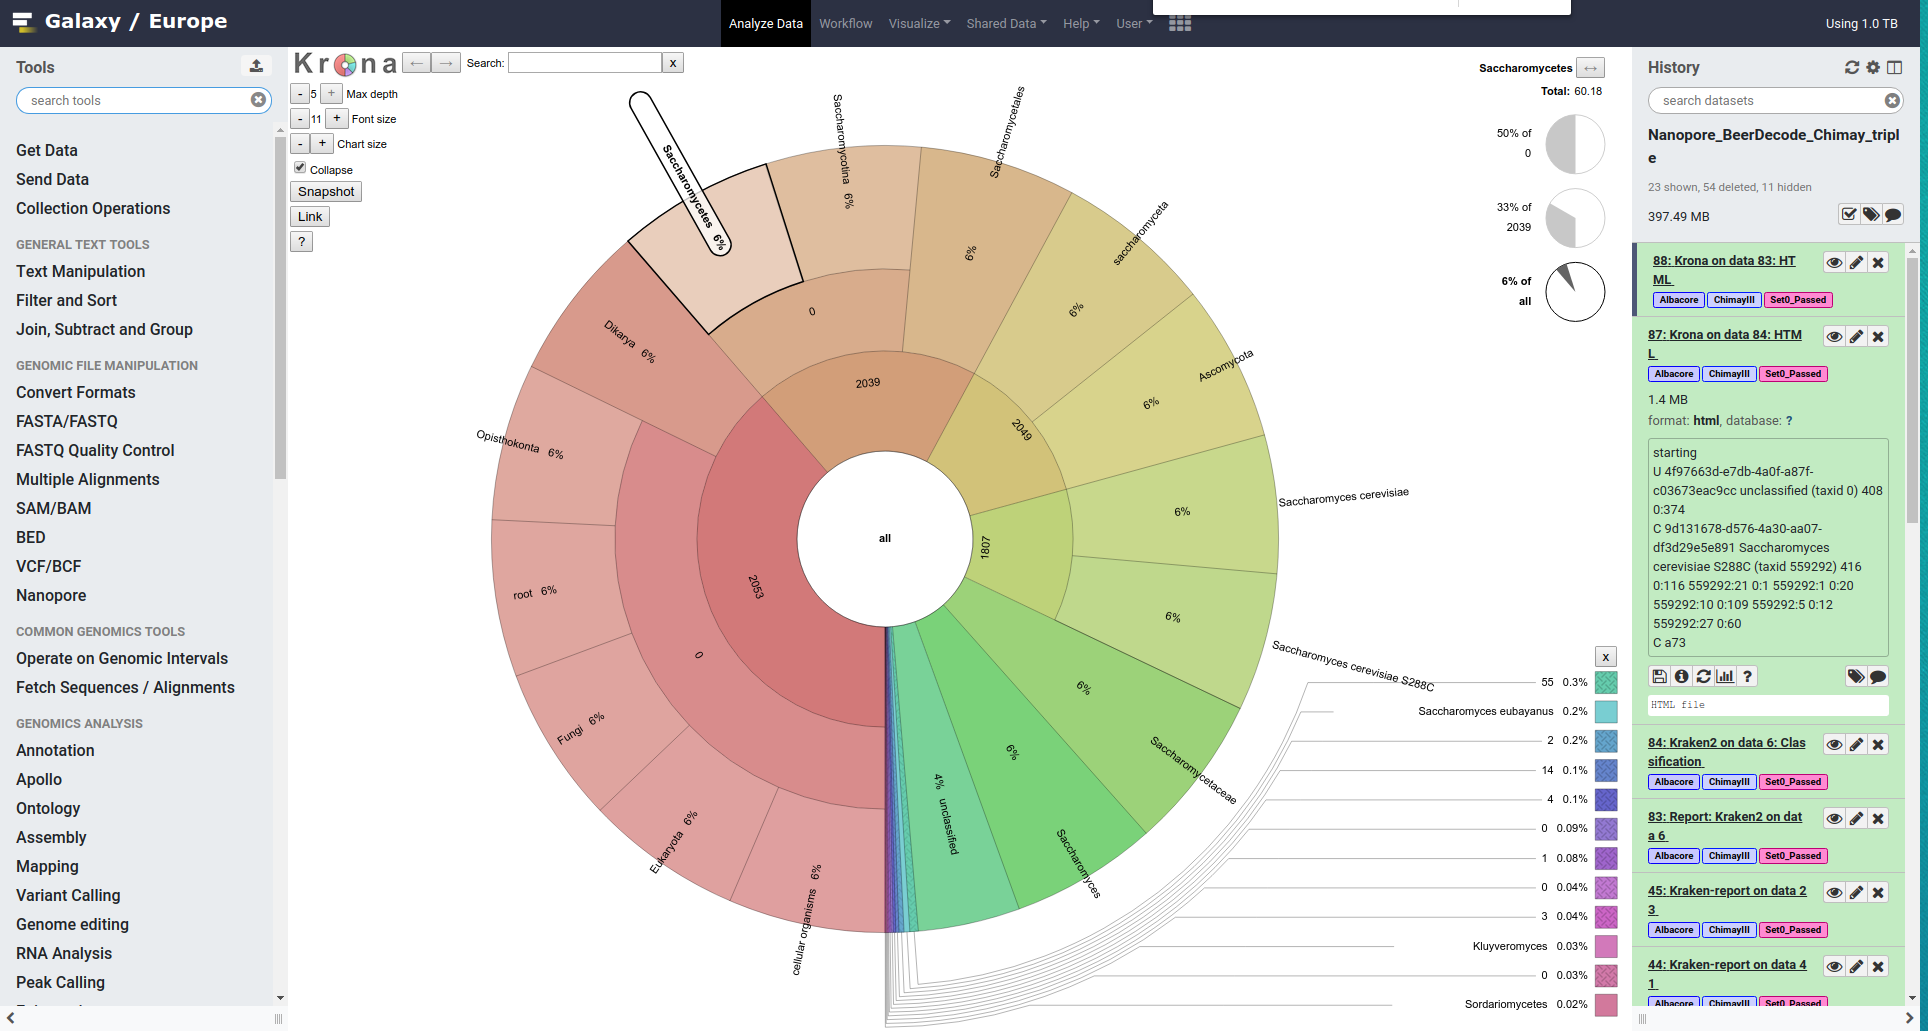
We would like now to visualize this information using Krona
- Search for Krona pie chart from the tools section
- Run Krona pie chart
- “What is the type of your input data”:
Tabular- “Input file” * : report from Kraken2
- “What is the type of your input data”:
(*) Some reformatting of the data might be needed for a proper visualization, please refer to the history.
A Galaxy history for the kickoff sequencing data is available on streetscience.usegalaxy.eu
This will generate an interactive html chart.
Using One Codex web server (simple)
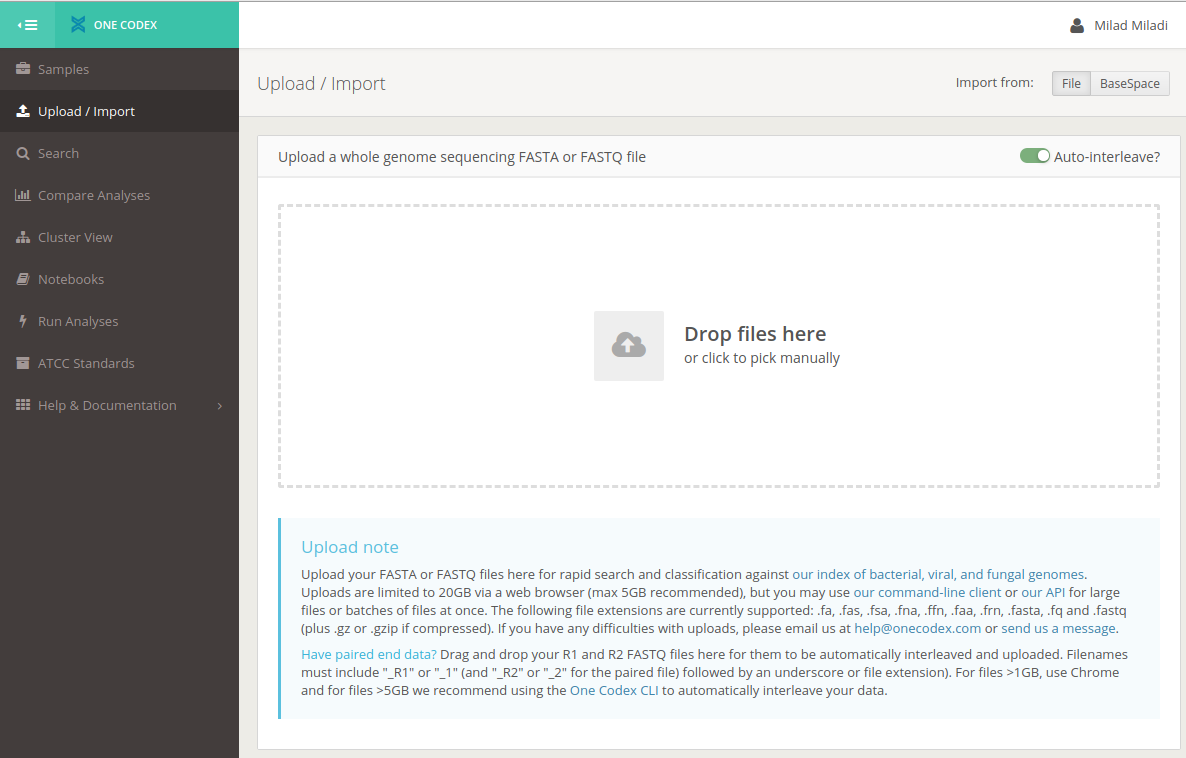
- Register for a free academics account at One Codex
-
Upload the fastq file
The fastq is the ultimate output of sequencing that is generated by MinKnow internal basecaller or by alternative basecaller like Albacore.
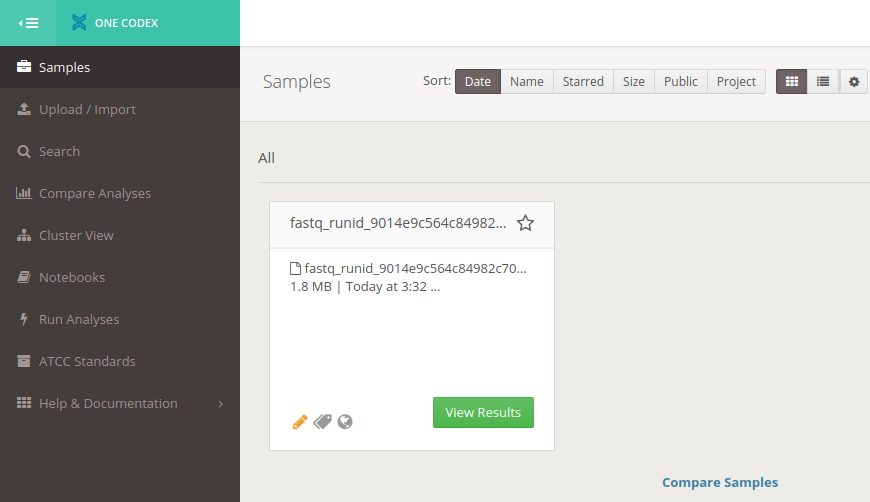
-
Click on the Results buttom from the samples tab on the top left panel
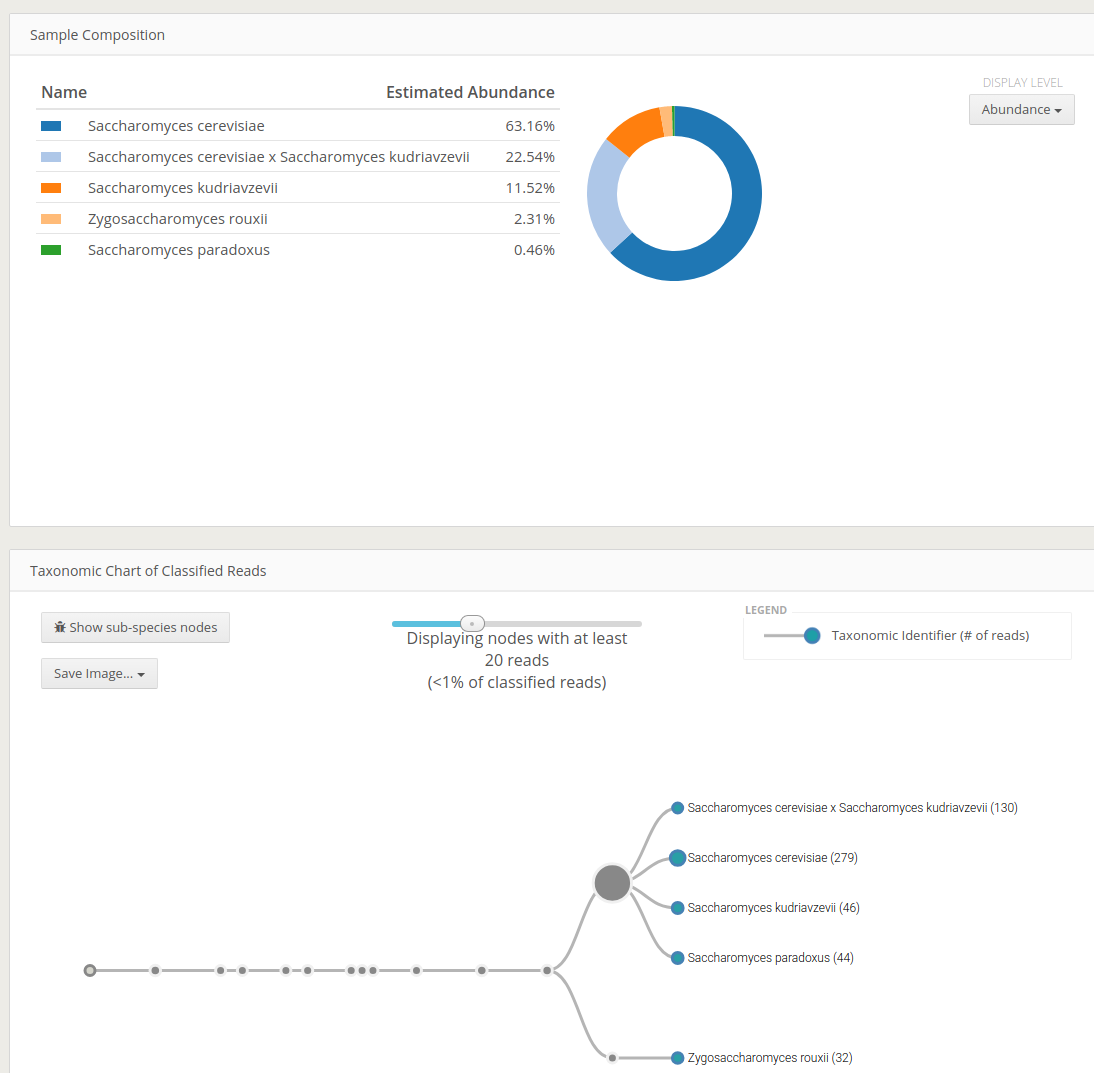
It might take a few minutes until the results are getting available. You should see something like this:
Codex reports an intuitive interactive html output of the classification. The visually interesting result would be Taxonomy Chart of Classified Reads